U.S. Stock Market Sets Records, But Historical Trends Suggest Bearish Indicators
Historic gains provide temporary relief, but market trends suggest caution in the near future.

Key Points:
-
Large rallies like these have historically occurred during economic downturns, as observed in 2001 and 2008, often signaling further market declines ahead.
-
Volatility and global bond pressures remain high, with the VIX hitting a record low and concerns now shifting from China to Japan’s bond market activities.
The Nasdaq surged 12% on Wednesday, marking its second-largest gain in history, following President Trump's announcement to pause the implementation of tariffs for 90 days. Strategy (MSTR), one of the quickest recovering stocks and part of the Invesco QQQ Trust, Series 1 (QQQ) ETF, jumped 25%.
At the same time, the S&P 500 rose nearly 10%, achieving its third-largest single-day gain, surpassed only by two days in 2008.
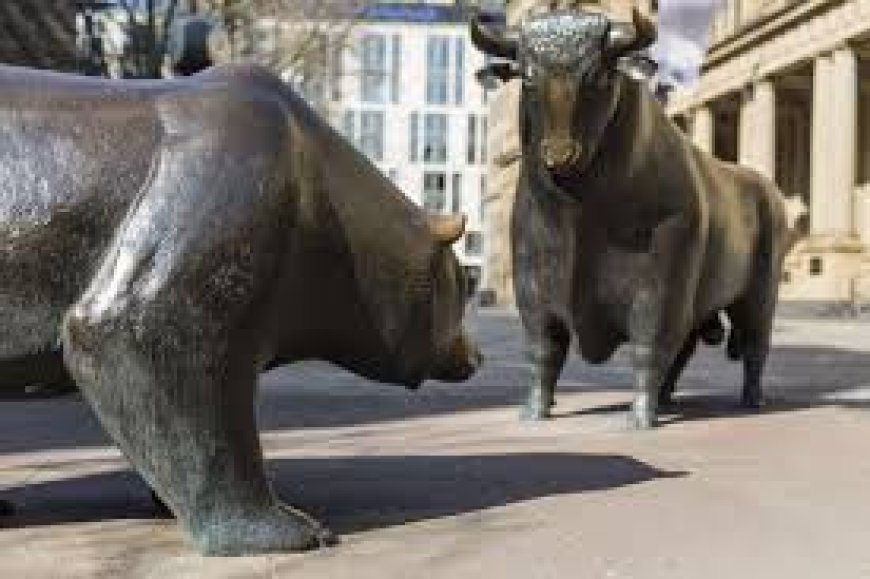
While this may appear bullish at first glance, it's important to recognize that the Nasdaq's three largest rallies occurred in 2001 and 2008—both during recessions, followed by further declines. Similarly, the S&P 500's two biggest gains also came during the 2008 financial crisis. Investors should remain cautious of potential bear market rallies.
There is growing speculation regarding why Trump reversed his stance on tariffs. Rising bond yields were unsettling global markets, and according to FOX Business Senior Correspondent Charles Gasparino, the pressure in the bond market may have been driven by Japan selling bonds, rather than China, as many initially thought.
As the market surged, the VIX (Volatility Index) closed at 34, posting its biggest one-day percentage drop ever, surpassing the 2010 record.
Bitcoin (BTC) also saw a spike, briefly rising above $82,000, but it continues to stay within the downward trend it has followed since January.
What's Your Reaction?
 Like
0
 Dislike
0
 Love
0
 Funny
0
 Angry
0
 Sad
0
Sad
0
 Wow
0
Wow
0


