


Bitcoin's support around $82K is at risk as the Nasdaq forms a 'double top,' signaling a weakening technical outlook for both BTC and the stock index
Bitcoin's long-term recovery depends on the Nasdaq's upward trend, emphasizing their strong positive correlation
Key Points:
- On Monday, the Nasdaq confirmed a double top breakdown, reinforcing a bearish outlook for Bitcoin.
- Both Bitcoin and the Nasdaq lost bullish momentum simultaneously in December.
According to research firm Ecoinometrics, Bitcoin's long-term recovery depends on the Nasdaq's upward trend, emphasizing their strong positive correlation.
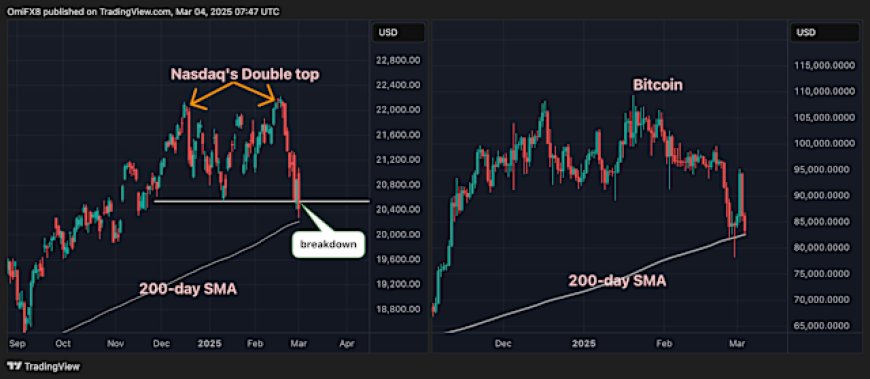
However, Monday's "double top" breakdown in the Nasdaq signals a major bearish reversal, jeopardizing Bitcoin's support at the 200-day simple moving average (SMA).
Bitcoin, the most valuable cryptocurrency by market capitalization, has declined over 10% in the past 24 hours, wiping out Sunday’s surge to $95,000. According to TradingView data, prices momentarily touched the 200-day SMA support at $82,587 earlier today.
The 200-day SMA is considered a key indicator of long-term trends, and falling below this level is often seen as a potential signal for further losses.
BTC's potential drop below its long-term average remains a possibility, as the Nasdaq—a tech-heavy Wall Street index—declined 2.2% on Monday, confirming a double top breakdown.
A double top consists of two peaks separated by a trough, typically forming over two to six weeks. According to technical analysis, the peaks should be no more than 5% apart, while the distance between the peaks and the trough should be at least 10%. However, these are guidelines rather than strict rules, with the overall market context playing a crucial role. For the pattern to be valid, it should emerge after a prolonged uptrend, which aligns with Nasdaq’s movement.
Since mid-December, the Nasdaq has formed two peaks near $22,200, with a trough at $20,538. On Tuesday, the index closed below this trough, confirming the bearish double top reversal.
Technical analysis suggests that the subsequent decline could reach at least 70% of the distance between the peaks and the trough, potentially pushing the Nasdaq down to 19,400. Historical data shows an 11% failure rate for this pattern, meaning breakdowns typically result in further losses.
Both the Nasdaq and Bitcoin lost their bullish momentum in December and have since peaked, now trading near their respective 200-day moving averages.
If Bitcoin falls below the 200-day SMA, the next key support level is at $73,757, which was previously a record high and has now turned into a support zone.
What's Your Reaction?
 Like
0
Like
0
 Dislike
0
Dislike
0
 Love
0
Love
0
 Funny
0
Funny
0
 Angry
0
Angry
0
 Sad
0
Sad
0
 Wow
0
Wow
0


